
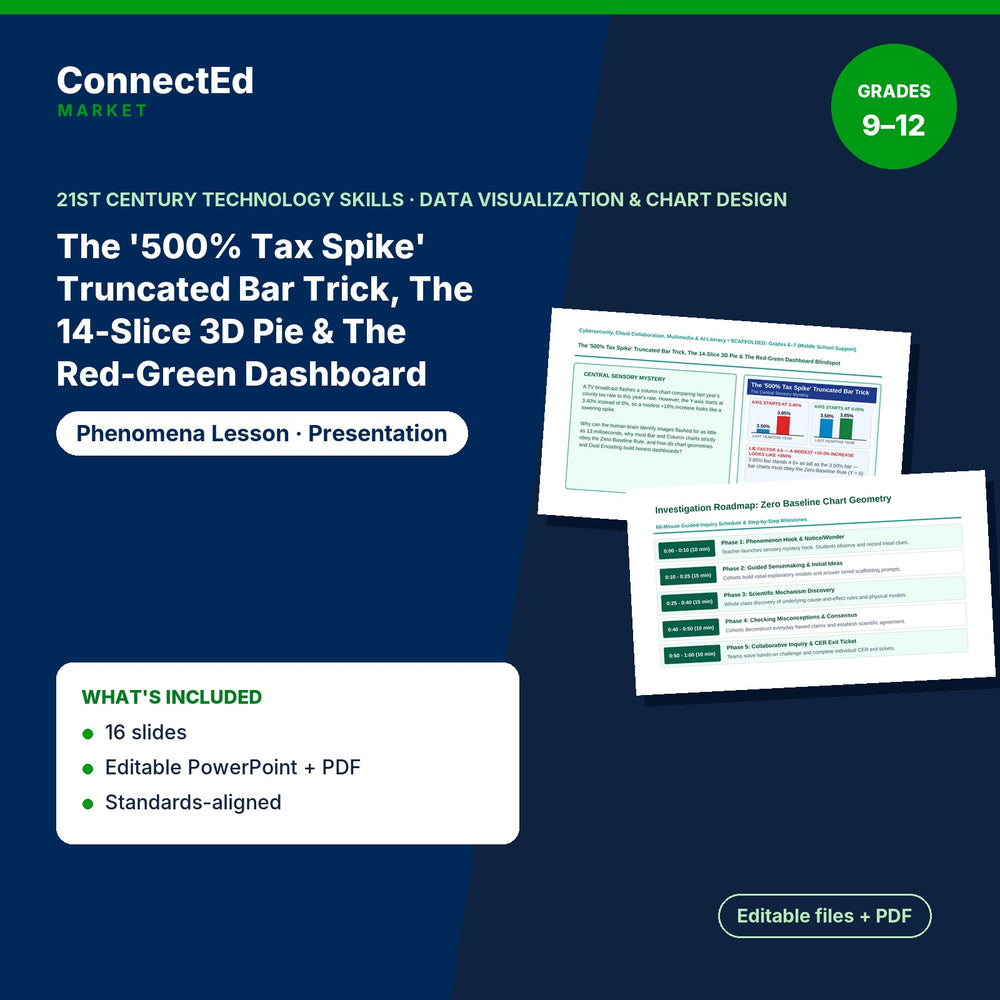
Data Visualization & Chart Design Scaffolded Phenomena-Based Lesson: The '500% Tax Spike' Truncated Bar Trick, The 14-Slice 3D Pie & The Red-Green Dashboard Blindspot Presentation
$5.00
Microsoft PowerPoint (editable) + PDF (ready to print) · Instant download
This is the student-facing slide presentation that introduces the phenomenon, walks the class through observations and driving questions, and frames the evidence students will use for the Scaffolded Phenomena-Based Lesson in the 21st Century Technology Skills (grades 9–12) chapter Data Visualization & Chart Design, built around the phenomenon The '500% Tax Spike' Truncated Bar Trick, The 14-Slice 3D Pie & The Red-Green Dashboard Blindspot. This scaffolded version adds sentence frames and extra supports for students who need them. It is sold separately from the other two parts of the set.
Complete the set: Data Visualization & Chart Design Scaffolded Phenomena-Based Lesson: The '500% Tax Spike' Truncated Bar Trick, The 14-Slice 3D Pie & The Red-Green Dashboard Blindspot Teacher Discussion Guide; Data Visualization & Chart Design Scaffolded Phenomena-Based Lesson: The '500% Tax Spike' Truncated Bar Trick, The 14-Slice 3D Pie & The Red-Green Dashboard Blindspot Student Response Sheet.
Sections: Section 1: Three-dimensional Learning Alignment (ngss); NGSS Dimension; Scaffolded Three-dimensional Learning Goal; Section 3: Scaffolded Science Talk Moves Matrix; Scaffolded Talk Move; Verbatim Facilitation Prompt & Talk Goal; Everyday Student Misconception (flawed Claim); Scientific Evidence & Intuitive Correction. Sample item: “To compare discrete categories, analysts use a ____________ chart (with a mandatory Y = 0 baseline), whereas continuous changes over time require a ____________ graph.”
What's inside: SCAFFOLDED Student Slide Show (editable .pptx + PDF, 16 slides).
Aligned Standards: Aligned to national Business, Computer & Information Technology standards (NBEA) for 21st Century Technology Skills, with embedded academic literacy and career-readiness skills.
Format: Microsoft PowerPoint (editable) + PDF (ready to print)
Classroom use: Project this presentation to introduce the phenomenon and guide the investigation, then move into discussion with the teacher guide.
Format note: If you do not open files with Microsoft Office, use the included PDF.